
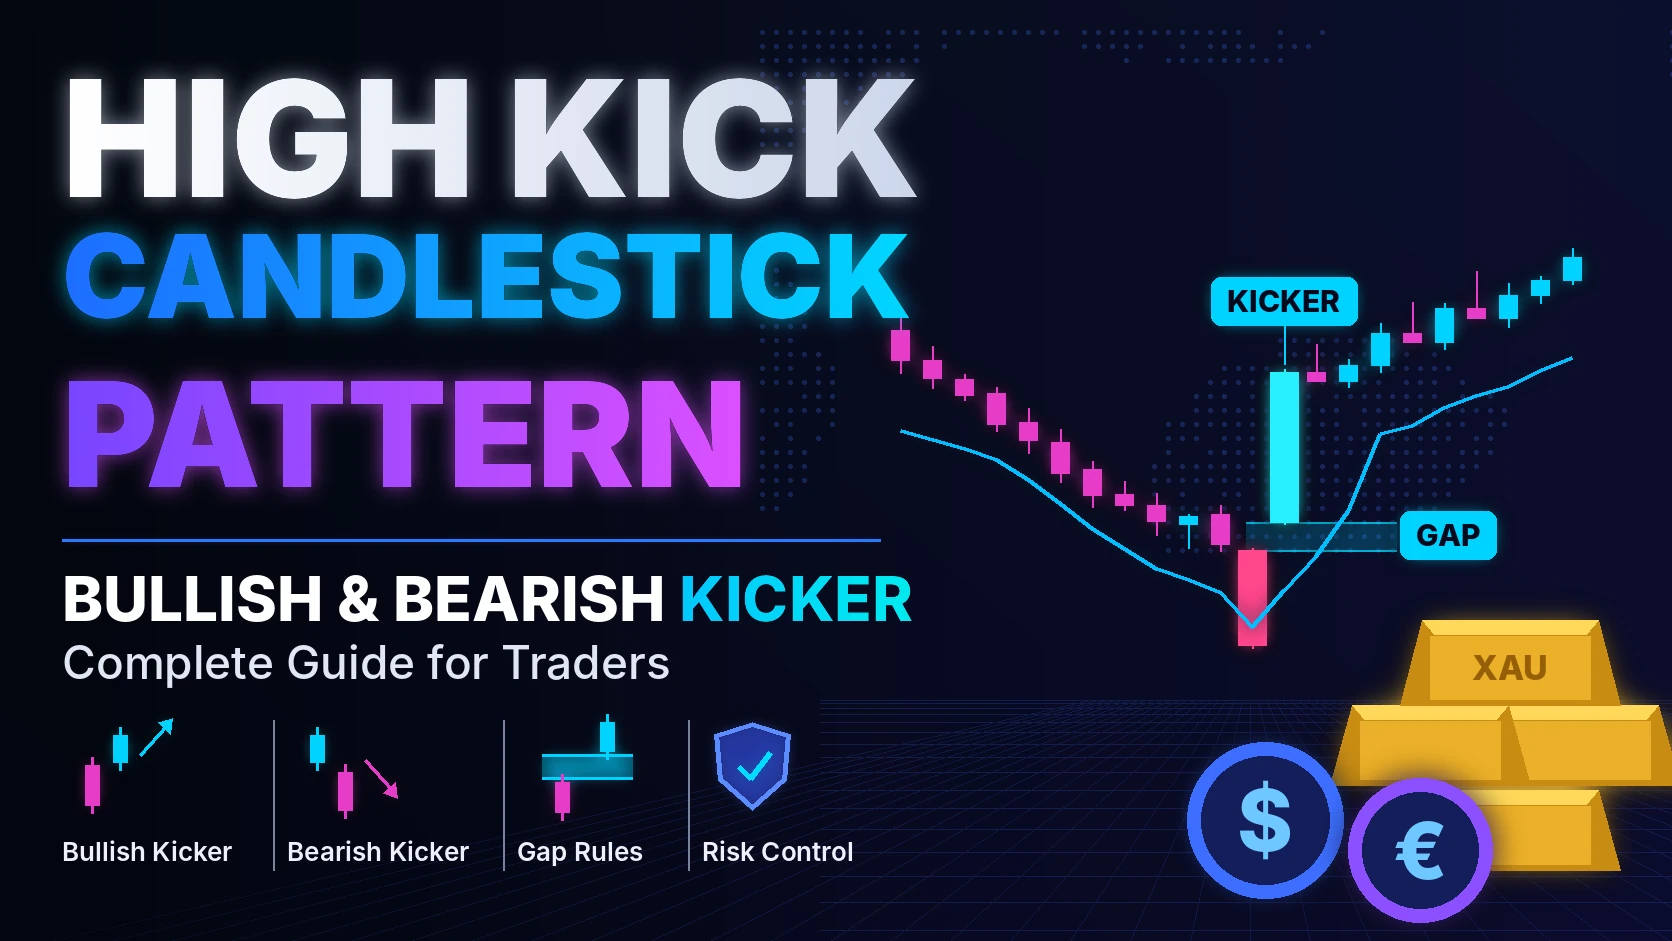
Some candlestick patterns whisper. The high kick candlestick pattern shouts.
One day the market is moving firmly in one direction. The next session opens with a gap the other way and never looks back. Traders who were sitting on the old trend get caught on the wrong side, and they feel it fast. That is why many traders call it a “kick.”
You will see this setup called the kicker pattern, the kicking pattern, or the high kick candlestick. They all describe the same two-candle reversal. In this guide you will learn how to spot the bullish and bearish versions, what the real test data says about its reliability, how to trade it with a clear stop, and why it behaves differently in forex and gold than it does in stocks.
What Is a High Kick Candlestick Pattern?
A high kick candlestick pattern is a two-candle reversal signal. A strong candle in one direction is followed by a strong candle in the opposite direction that opens with a gap beyond the first candle’s open. The two bodies never overlap, which shows that market sentiment flipped completely between sessions.
In its strict textbook form, both candles are marubozu candles. A marubozu has a full body and little or no wick, meaning price opened near one extreme and closed near the other. Neither side showed any hesitation during the session.
“Kicking” is the original Japanese name. “Kicker” is the more common Western term. Steve Nison helped bring these Japanese charting ideas to Western traders in the early 1990s, and the pattern has been part of the standard candlestick catalogue ever since.
One detail makes the kicker unusual. Most reversal patterns need a clear prior trend to mean anything. Classic candlestick sources treat the kicker as meaningful even without one, because a full gap plus a full-bodied candle is a strong statement on its own.
The Bullish Kicker Pattern
A bullish kicker shows sellers losing control overnight. Here is how to identify one:
- Candle 1 is a long bearish candle, ideally a black marubozu that opens near its high and closes near its low.
- Candle 2 opens with a gap above candle 1’s open, not just above its close.
- Candle 2 is a long bullish candle that closes near its high, ideally a white marubozu.
- The two bodies do not overlap at any point.
What it tells you: the sellers who pushed price down on day one woke up to a market that had already moved past their entry. They didn’t get a chance to exit at a fair price. Buyers stepped in from the open and held control into the close. When a sharp reversal comes this cleanly, it usually follows news: an earnings surprise, a guidance change, or a major data release.
The Bearish Kicker Pattern
The bearish kicker is the mirror image. Buyers who felt comfortable one day find themselves trapped the next.
- Candle 1 is a long bullish candle, ideally a white marubozu.
- Candle 2 opens with a gap below candle 1’s open.
- Candle 2 is a long bearish candle that closes near its low.
- Again, the bodies do not overlap.
What it tells you: late buyers who chased the rally have no room to get out. If the gap holds and the next few sessions stay below it, those trapped longs often add fuel to the move as they cut their positions. A bearish kicker near a prior resistance zone or after an extended rally deserves extra attention.
How Reliable Is the Kicker Pattern, Really?
Read ten articles on the kicker and most will call it one of the most reliable reversal patterns in technical analysis. The tested numbers tell a more modest story.
Thomas Bulkowski, author of Encyclopedia of Candlestick Charts, tested more than 100 candlestick patterns on historical stock data. His published results for the kicker:
| Pattern | Acts as a reversal | Overall performance rank |
|---|---|---|
| Bullish kicking | 53% of the time | 96 |
| Bearish kicking | 54% of the time | 102 |
A rank close to 100 places the kicker near the bottom of his list. He also found the pattern extremely rare: only 116 bearish kickers in more than 4.7 million candles.
So why does the “most reliable” reputation stick around? A few reasons:
- Strict versus loose definitions. A perfect kicker with two clean marubozu and a true gap is rare. Many charts labelled as kickers are looser versions that behave more like ordinary gaps.
- Memorable winners. The kickers people remember came after big news and ran hard. The ones that stalled get forgotten.
- The gap does the work early. Sometimes the gap itself prices in the news. By the time you enter, much of the move is already done.
The practical takeaway: treat the kicker as a strong alert, not an automatic trade. It tells you sentiment shifted. Context and confirmation tell you whether the shift will last. Bulkowski’s own notes point the same way: taller candles tended to perform better.
Kicker vs Engulfing vs Island Reversal
These three patterns get confused often. The gap is what separates them.
| Feature | Kicker | Engulfing | Island reversal |
|---|---|---|---|
| Number of candles | Exactly 2 | 2 | Several, often many |
| Gap required | Yes, one gap past the prior open | No | Yes, two gaps |
| Bodies overlap | Never | Second body wraps the first | Island is cut off on both sides |
| Prior trend needed | Traditionally not | Yes | Yes |
| How often it appears | Rare | Common | Uncommon |
The simplest test: if the second candle trades back into the first candle’s body, it is not a kicker. It may be a bullish or bearish engulfing pattern instead. That pattern can still be useful, but it signals a less abrupt change in sentiment.
How to Trade the Kicker Pattern
A kicker gives you something many patterns do not: a clear line where the idea is wrong. Build the trade around that line.
1. Check the context first. A bullish kicker near support, after a sell-off, or in an oversold market has more going for it. The same applies to a bearish kicker near resistance or after a long rally. Ask what caused the gap. A real catalyst (earnings, a rate decision, a big data surprise) gives the move a reason to continue.
2. Look for volume. On stocks and futures, the second candle should come with clearly higher volume than recent sessions. A big gap on thin volume is easier to reverse.
3. Choose your entry.
- Aggressive: enter near the close of the second candle, once the pattern is complete.
- Conservative: wait for the next session. Enter only if price holds above the gap (bullish) or below it (bearish), or on a pullback toward the gap edge.
The conservative entry costs you some of the move but filters out kickers that fade straight away.
4. Place the stop beyond the gap. The gap is your invalidation zone. If price closes back inside it, the “no way back” story has failed. For a bullish kicker, a common stop sits just below the first candle’s open. For a bearish kicker, just above it. Size the position so that a hit stop is a loss you can live with, and the right forex risk management tools make that much easier. Always use a stop. On leveraged forex accounts, losses can exceed your deposit if price gaps hard against you.
5. Plan the exit. Use the nearest major support or resistance level as a first target, or trail your stop under higher lows (bullish) or above lower highs (bearish). Because the gap can be wide, check that your reward still covers your risk before you take the trade.
6. Add one confirming tool. A move back above a key moving average, RSI leaving an extreme zone, or a break of a nearby trendline can all support the signal. Keep it simple. One or two confirmations are enough.
Does the Kicker Pattern Work in Forex and Gold?
This is where most guides go quiet, and it matters if you trade currency pairs or XAUUSD.
The kicker depends on a gap. Stocks gap all the time because the exchange closes overnight and news arrives while no one can trade. Forex and spot gold trade almost around the clock from Monday to Friday. Price rarely jumps from one level to another without trading in between, so a strict kicker is rare on these charts. Crypto, which trades 24/7, sees true gaps even less.
That does not make the idea useless. You just need to know where kicker-style moves show up:
- The weekly open. Gold and major pairs can open Monday with a real gap after weekend news. A strong Friday candle followed by a full-bodied Monday candle in the opposite direction, gapping past Friday’s open, is the closest thing to a textbook kicker you will find in forex.
- High-impact news on lower timeframes. NFP, CPI or a central bank decision can produce a sharp reversal candle on M15 or H1. These usually lack a true gap, so treat them as “kicker-like” momentum reversals, not the strict pattern.
- Broker data differences. Session start times and data feeds differ between brokers. A gap visible on one platform may be smaller or missing on another. Check before you rely on it.
For gold traders, the honest approach is to use kicker logic as a sentiment clue: a full-bodied reversal candle that leaves the previous candle’s range untouched. Then lean on context, levels and confirmation even more than you would with stocks.
Common Mistakes Traders Make With Kickers
- Calling every gap a kicker. If the second candle opens above the first candle’s close but below its open, that is not a kicker. The gap has to clear the open.
- Ignoring wicks. Long shadows mean the session was contested. The less wick on both candles, the cleaner the signal.
- Chasing a huge gap. When the gap is very large, your stop sits far away and the reward may not justify it. Sometimes the right trade is no trade.
- Skipping the news check. A kicker caused by a one-off headline that gets corrected can reverse just as fast.
- Holding after the gap fills. Once price closes back inside the gap, the pattern has failed. Respect your stop.
Final Thoughts
The high kick candlestick pattern is easy to spot and hard to ignore. Two full-bodied candles pointing in opposite directions, a gap in between, and no way back for the traders on the wrong side.
Just don’t let the hype set your expectations. The test data shows a kicker on its own is close to a coin flip. Its real value is as an early warning that sentiment has changed. Pair it with key levels, volume, a real catalyst and a stop beyond the gap, and it becomes a far more useful tool. That holds even more in forex and gold, where true gaps are scarce.
FAQs
It is another name for the kicker or kicking pattern. A strong candle is followed by a strong opposite candle that gaps past the first candle's open, with no overlap between the bodies.
It can be either. A bullish kicker gaps up after a bearish candle. A bearish kicker gaps down after a bullish candle.
Less reliable than its reputation suggests. Bulkowski's testing found it reversed the trend only about 53–54% of the time. Use it with context, volume and confirmation.
An engulfing candle wraps around the previous body without needing a gap. A kicker gaps entirely past the previous open, so the two bodies never touch.
Rarely in the strict form, because forex trades almost continuously. The best chances come at the weekly open after weekend news.